
PerfView
Debug CPU and memory issues effectively
Description
Targeted at software engineers, PerfView specializes in debugging CPU and memory-related problems by leveraging ETW and CLR data. It supports the collection of detailed traces from ETL files and heap dumps, which can be explored in a structured interface. Users can pinpoint performance hotspots, analyze garbage collection patterns, and understand thread activity. This comprehensive approach aids in optimizing application efficiency and stability, reducing downtime and improving user experience across Windows-based systems.
Screenshots
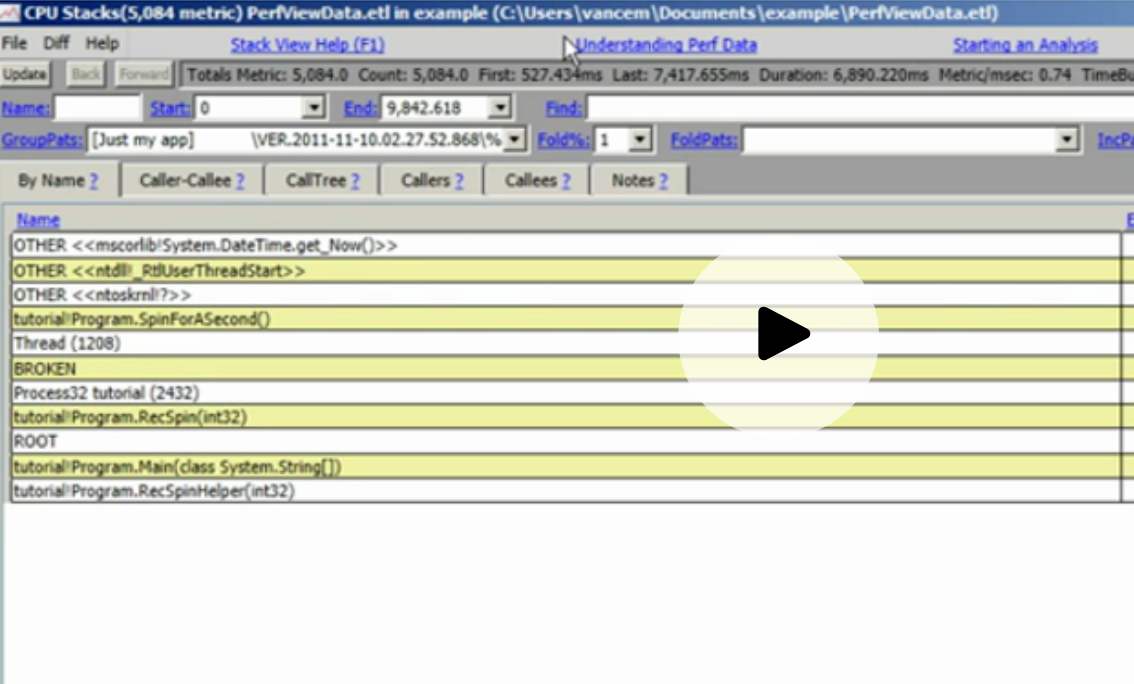
Click to view full size